86
NPS — 2× the SaaS average
20
countries of operator data
1
source of truth
The real interface
Straight from the product.
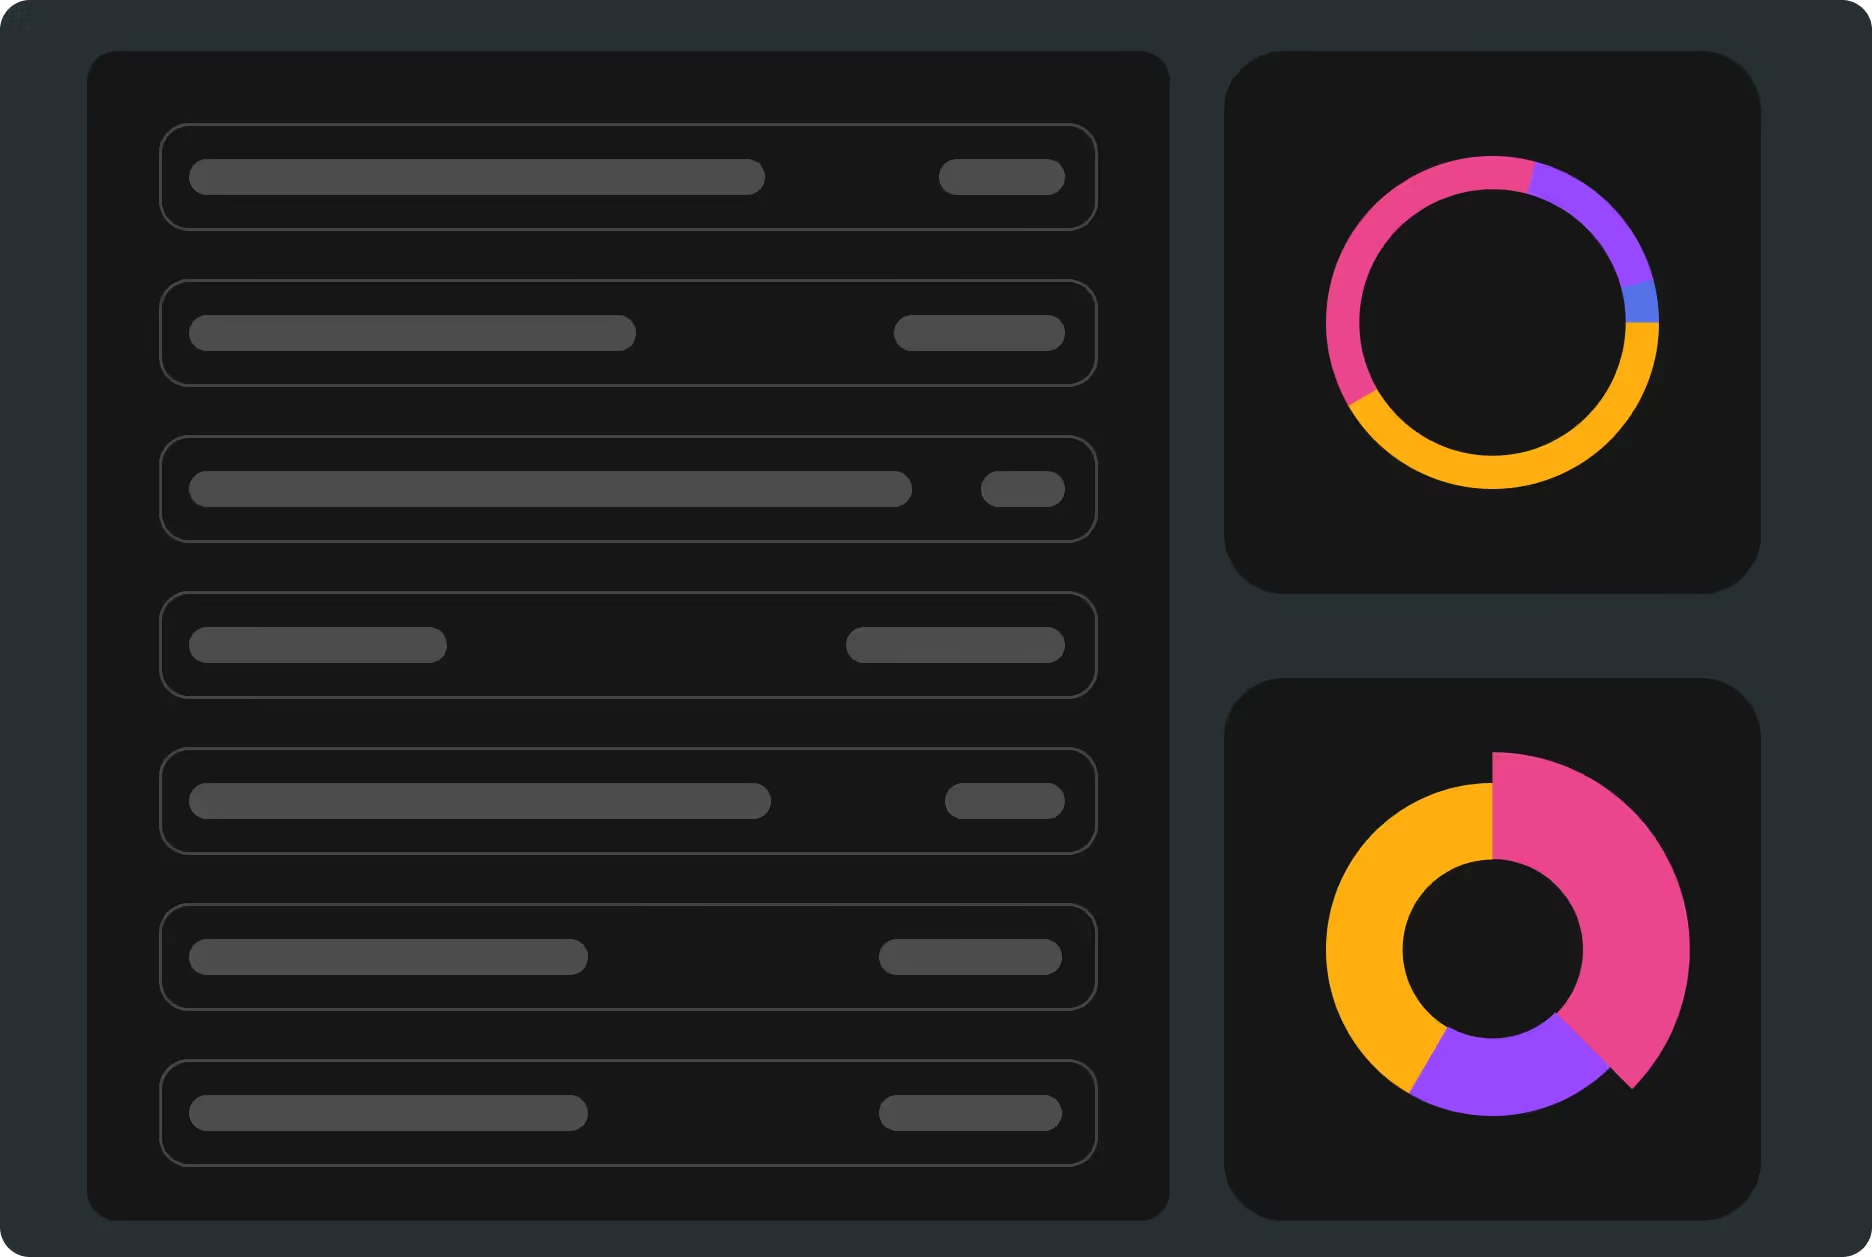

Real-time dashboards
Occupancy, ADR, RevPAR, revenue pace and review sentiment — portfolio-wide or per unit, always current.
The AI reads it for you
BAM monitors the numbers continuously and surfaces anomalies, risks and opportunities — then acts on them.
Know your guests
Booking patterns, demographics and sentiment analysis tell you what guests want before they ask.
Benchmark and beat the market
Track competitor pricing and market trends so you’re positioned to win every booking window.
Boom has revealed inefficiencies in our old way of working that we didn’t even notice.
Simon Pyne — Founder, PureServiced
Good questions.
Can I build custom reports?+
Dashboards are filterable by property, owner, channel and date range — and export cleanly when you need them elsewhere.